Downscaling: Mapping the clean energy transition
Learn what Downscaling is, how it's used in energy modeling, and why it transforms how we interact with siting, transmission, and planning.

When we talk about energy transition, the conversation often centers on large-scale goals, like doubling grid capacity, reaching net-zero emissions, or building thousands of gigawatts of clean power. Implementation of infrastructure and policy, however, don’t happen in the abstract—they must happen somewhere. Success hinges on understanding where these changes can and should occur, and what the potential impacts are.
What is Downscaling?
In energy modeling, downscaling translates broad-scale results—like national demand forecasts or regional energy capacity targets—into fine-grained, spatially resolved outputs at the state, county, or even grid-cell level. This higher-resolution view enables planners and policymakers to assess the physical, economic, environmental, and social feasibility of energy infrastructure development.
At Evolved, downscaling and geographic analyses serve as both inputs and outputs within our modeling processes:
- Input: We begin with detailed land use assessments to identify candidate project areas (CPAs) for renewables and build geographically-informed supply curves to load into our models.
- Output: We downscale model results to show where energy infrastructure could be located in each scenario and how different decisions change geographic trends.
We integrate both statistical methods as well as dynamical relationships to infer and increase the resolution of our data geographically. This is often a combination of technical, environmental, demographic, and economic information fed into regressions or machine learning programs. These downscaling techniques are frequently combined with general spatial analysis methodology to refine the process into maps and datasets most useful to a decision-maker or client.
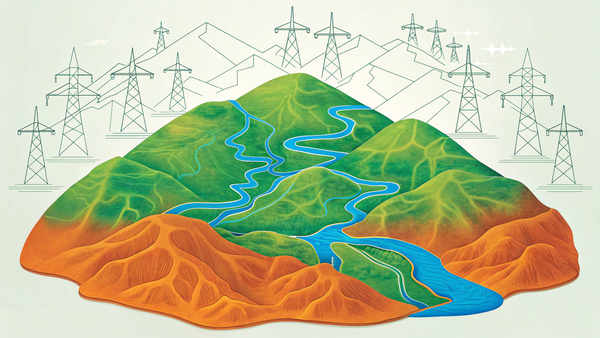
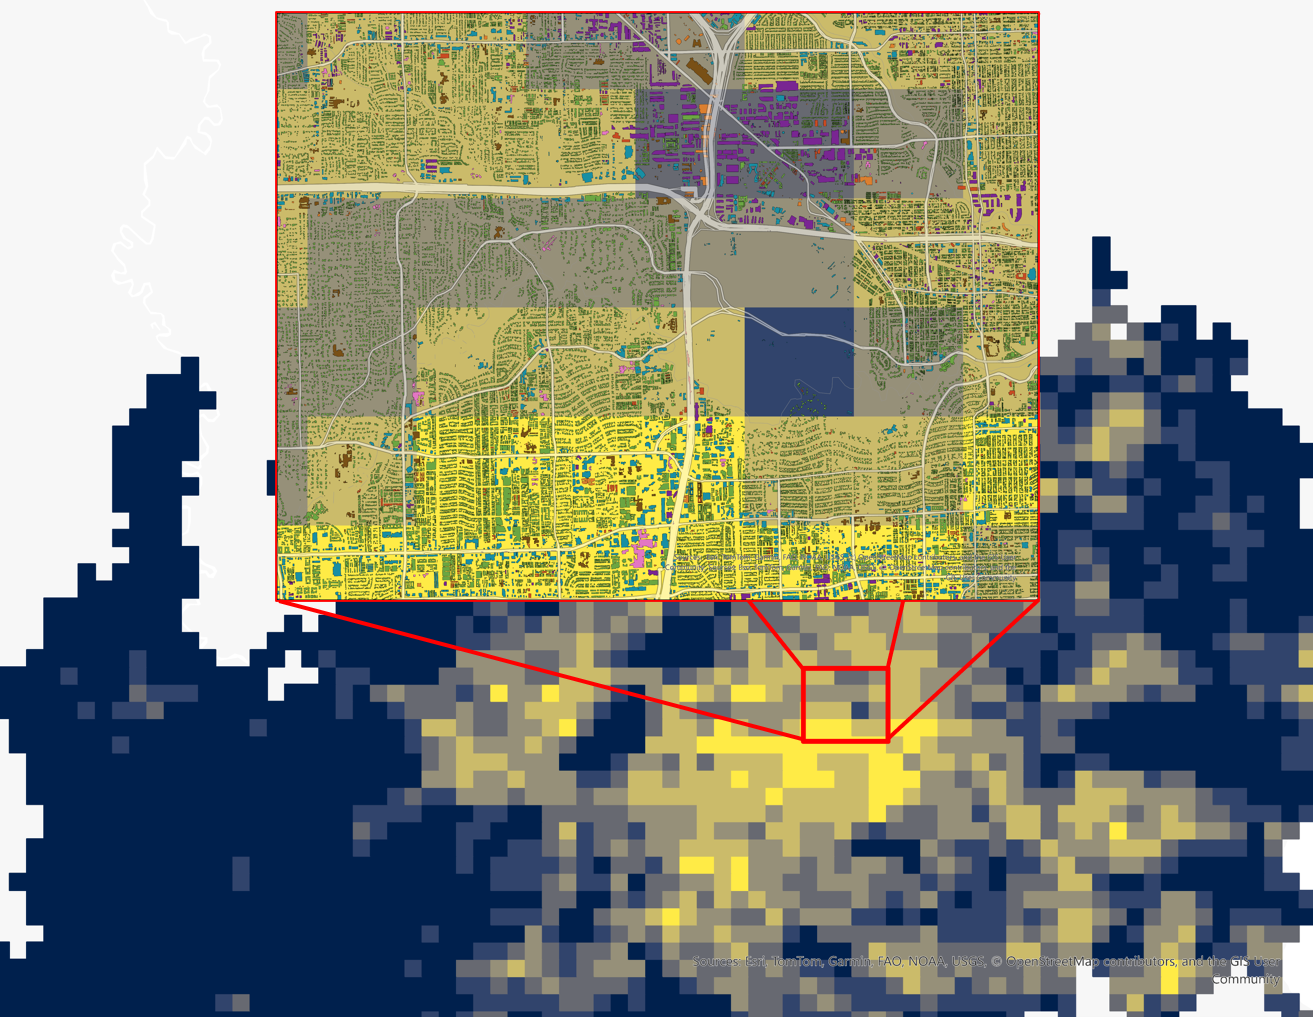
For example, in our most recent Annual Decarbonization Perspective (ADP) work we were able to examine the spatial impacts of different modeled energy systems, taking this:
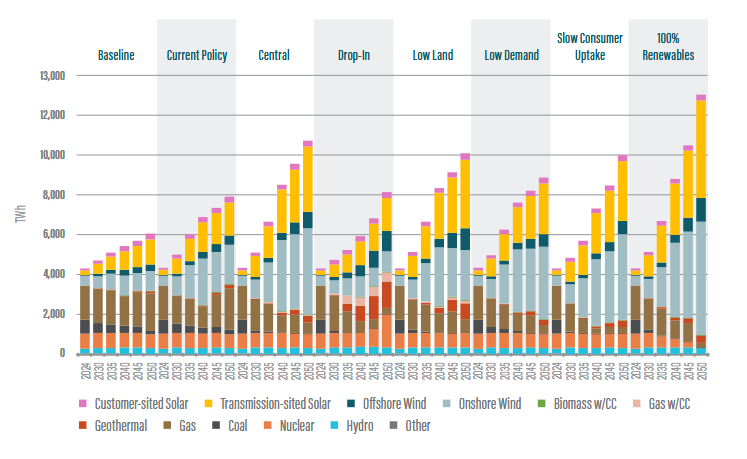
And creating datasets like these:
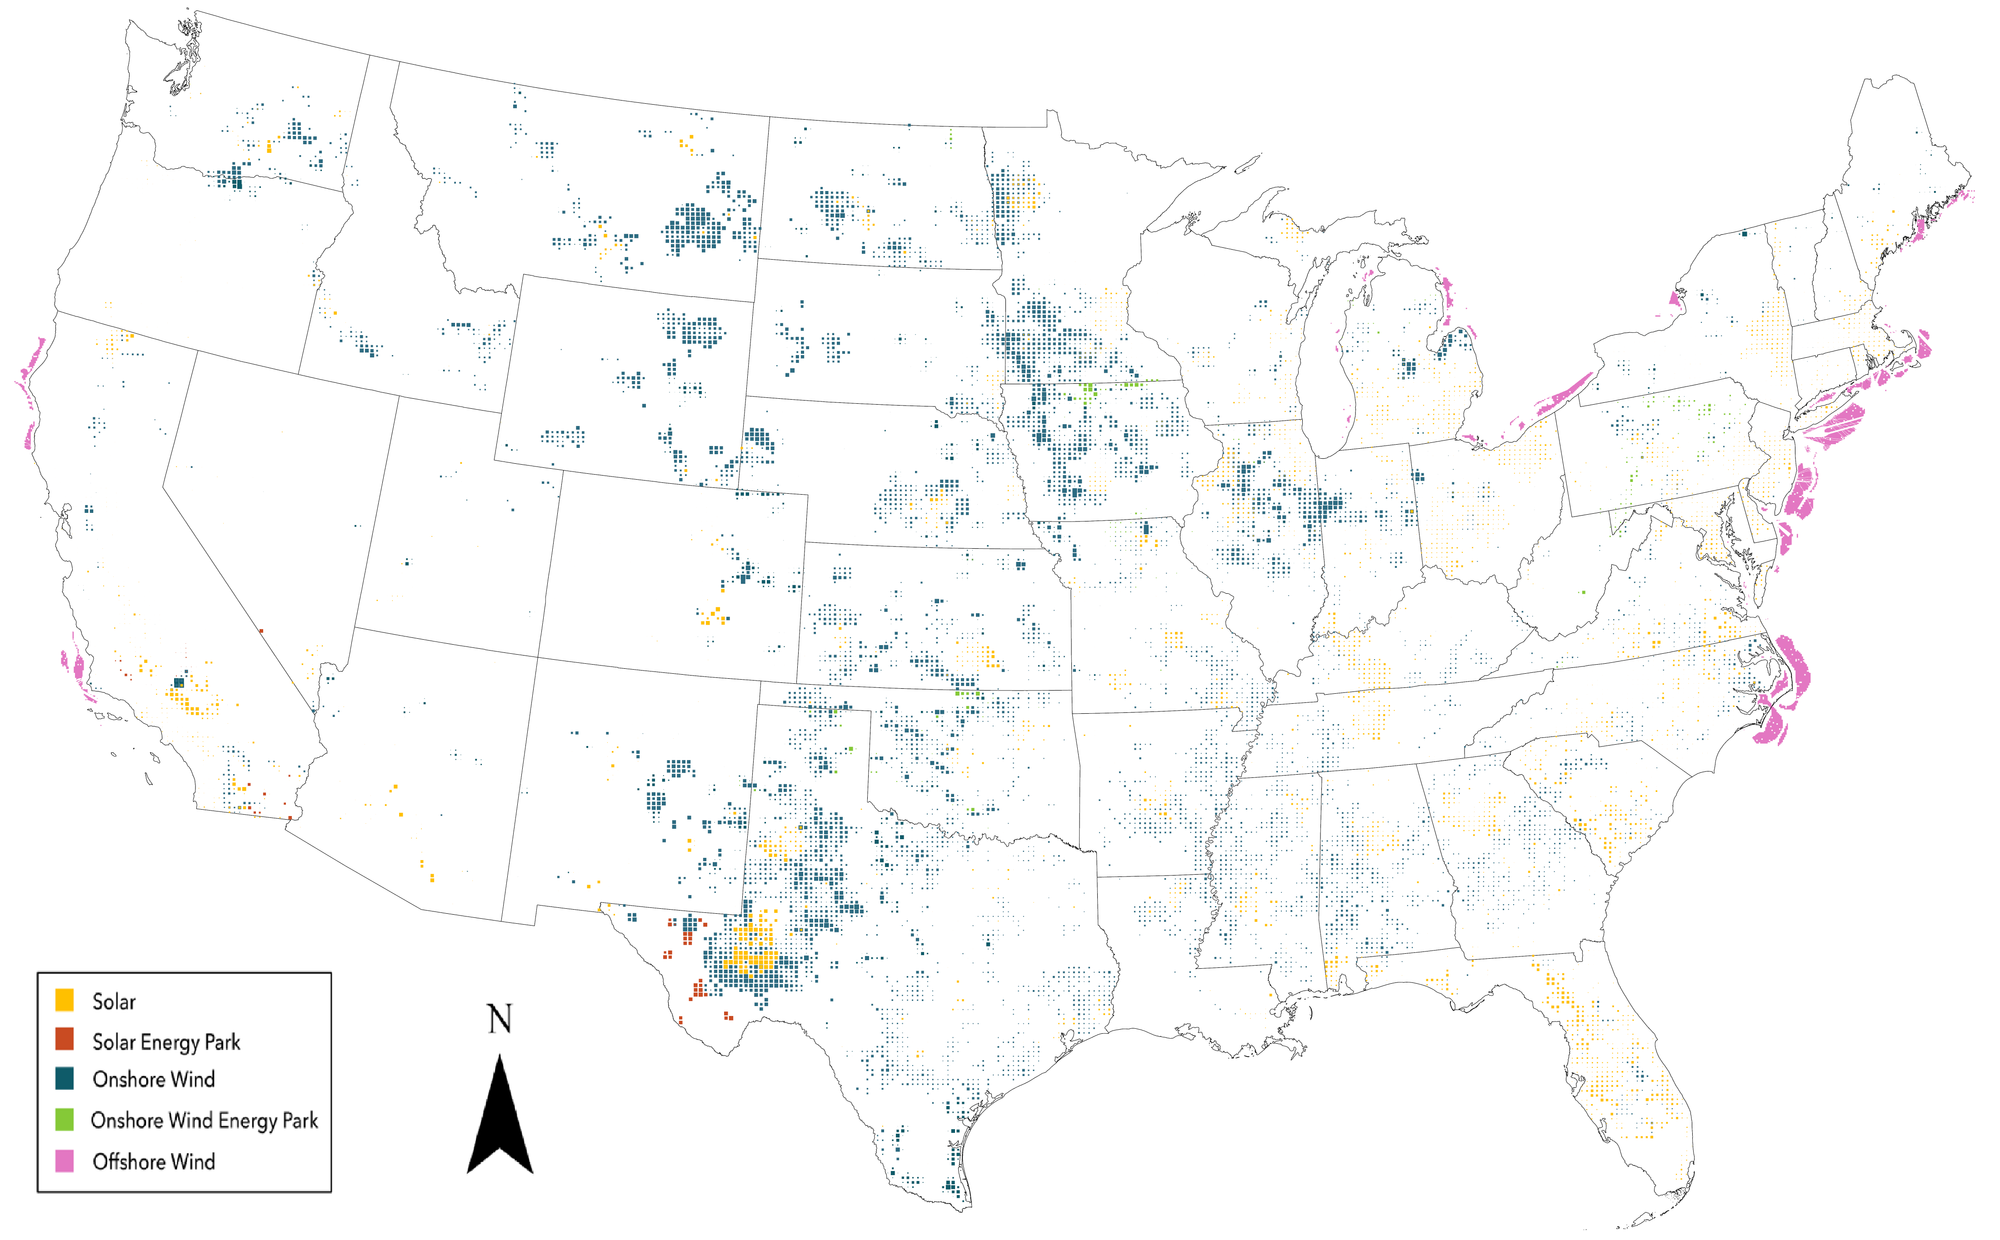
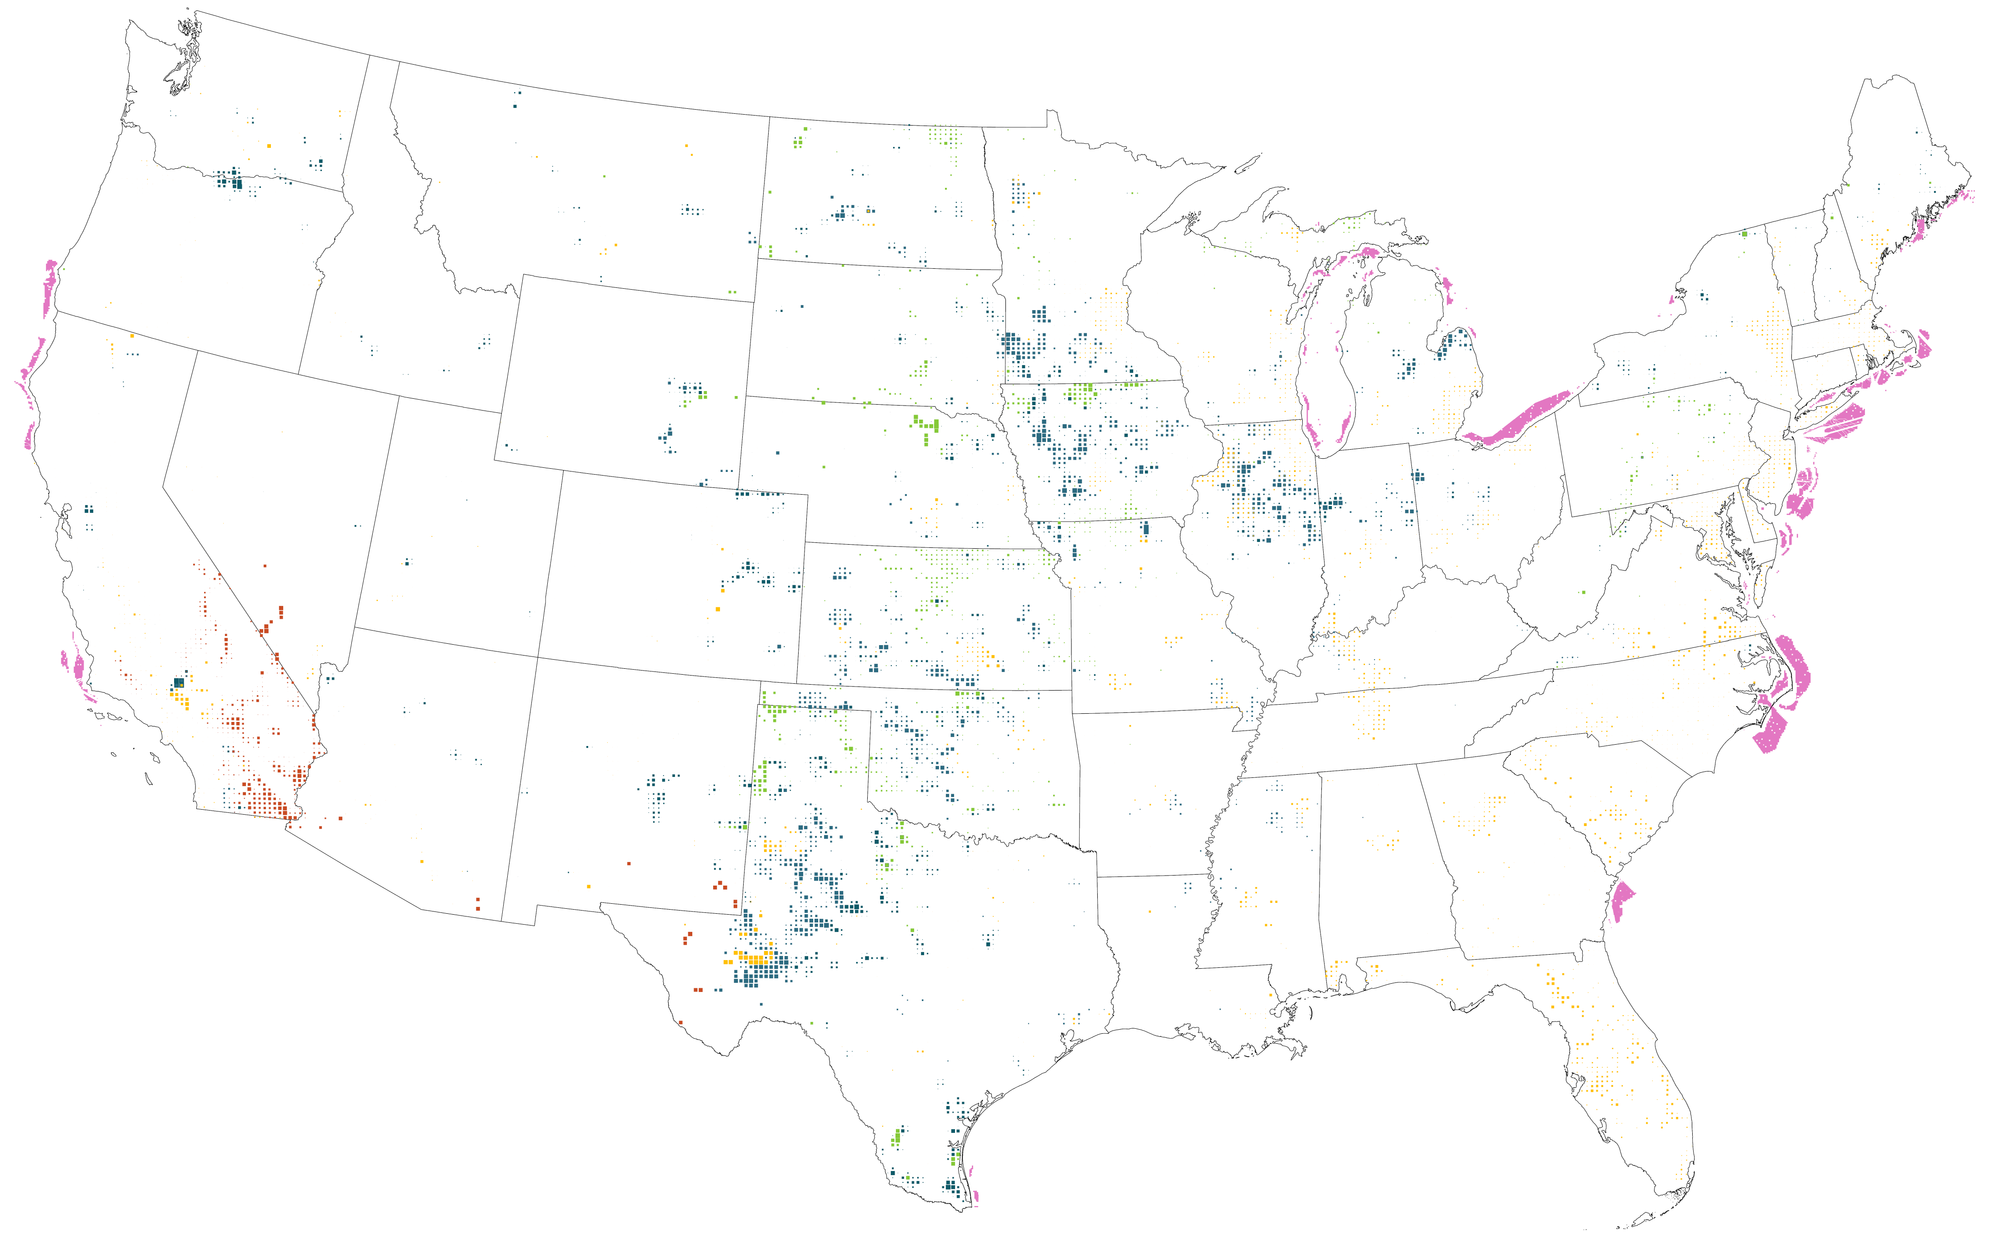
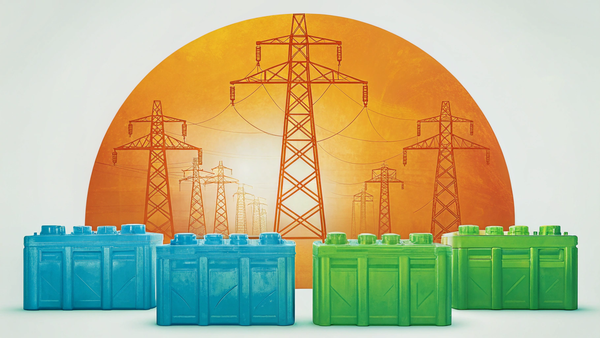
Figure 2. Downscaled model results showing Central (left) and Drop-In (right) Scenarios.
At a high level these maps are a useful tool for understanding the spatial trends of different potential future energy systems. But crucially, the underlying datasets also allow for further impacts analysis such as how spatially-dependent variables like average capacity factor or transmission cost change under different conditions.
Further Applications of Downscaling in Energy Modeling
The Impacts of Land Use and Siting for Renewable Deployment
Downscaling allows us to spatially map the land use requirements of renewable energy build-out and evaluate tradeoffs across scenarios. It helps answer questions such as:
- Where can we site new renewable energy projects with the least environmental impact or social concern?
- How will meeting renewable portfolio standards interact with local conservation goals?
- How will zoning or land use restrictions alter the pattern or cost of renewable development?
This analysis is central to our ADPs for the U.S. and Europe. We’ve also conducted it in the Power of Place studies for The Nature Conservancy, assessing how to deliver clean energy solutions while minimizing impacts to biodiversity and communities.
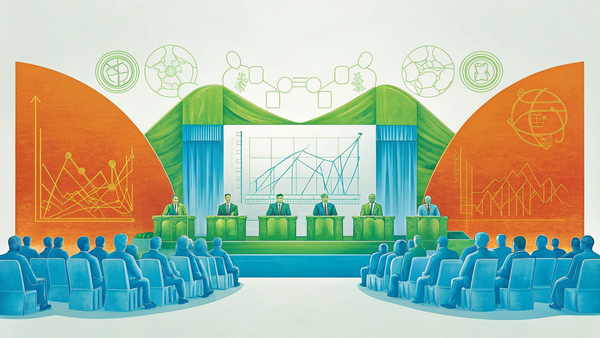
The map below demonstrates our downscaling for the 2024 European Annual Decarbonization Perspective, which allows users to interact with the results by region, scenario, resource, and year.
Figure 3. Interactive downscaling map showing resource distribultion for various decarboniztion pathways in Europe.
Transmission Pathing
In addition to traditional resource downscaling, we are developing new methods to integrate greater spatial awareness into transmission planning. This work enables us to:
- Identify the least-cost corridors for new transmission lines under different land use and environmental scenarios.
- Pinpoint high-suitability areas for development in land-constrained regions where spur line costs are a limiting factor.
- Assess how conservation priorities influence transmission distances and costs.
- Evaluate the relationship between transmission build-out and utility scale renewable development, identifying development-conscious transmission planning.
Demand Forecasting and Granular Allocation
Downscaling can also be used to sharpen the spatial resolution of demand projections—critical for transmission and utility system planning. We use it to answer:
- Under different load growth and electrification scenarios, where is increased demand from EVs or distributed solar likely to concentrate?
- Within an existing utility or grid service territory, where is electricity demand expected to rise most?
Local Suitability for Emerging Technologies
We also apply spatial analyses to explore the regional suitability of next-generation technologies such as clean fuels and hydrogen. These insights support strategic investment and regional planning by addressing questions like:
- Which geographic areas are best suited for hydrogen electrolysis development, and what spatial factors (e.g., access to renewables, water availability, infrastructure) most influence site suitability?
- Are there specific regions with the right mix of infrastructure and demographic or socioeconomic characteristics to support various types of clean energy or fuel production?
Conclusion: Turning Maps into Momentum
Downscaling and spatial modeling make energy system modeling more relatable and actionable. It connects high-level goals to real-world geographies—guiding infrastructure decisions, policy prioritization, and community engagement. As we scale up clean energy, we also have to scale down our lens—because where we build matters just as much as how much we build.