How OBBBA Rewrites America’s Energy Transition
New modeling explores how U.S. power systems evolve through 2040 under a reversal of federal policy.

Modeling a Changing Future
New U.S.-wide modeling explores how policy reversal and economic headwinds reshape America’s generation mix, investment patterns, and system costs through 2040.
After two years of record deployment under the Inflation Reduction Act (IRA), which flooded the market with incentives for wind, solar, and storage, the introduction of the One Big Beautiful Bill Act (OBBBA) has shifted the ground beneath every utility, developer, and policymaker. The OBBBA removes the subsidies that underpinned the renewable boom, recasting the investment landscape overnight. The contradiction is stark: decarbonization momentum collides with political reversal, and a grid poised for rapid expansion now faces uncertainty over what gets built next.
Those policy reversals unfold within a landscape already defined by powerful crosscurrents. Falling technology costs meet rising interest rates. Federal retrenchment meets state ambition. Geothermal, carbon capture, and advanced nuclear are maturing but depend on new infrastructure, supply chains, and regulatory clarity. Even gas plants are struggling to get built. Grid pressures are also mounting as electrification surges through vehicles, data centers, and manufacturing, testing the limits of a system already strained by transmission delays and interconnection backlogs. These tensions make a single “forecast” both unrealistic and unhelpful; what matters now is understanding the range of plausible futures and how resilient the system can be across them.
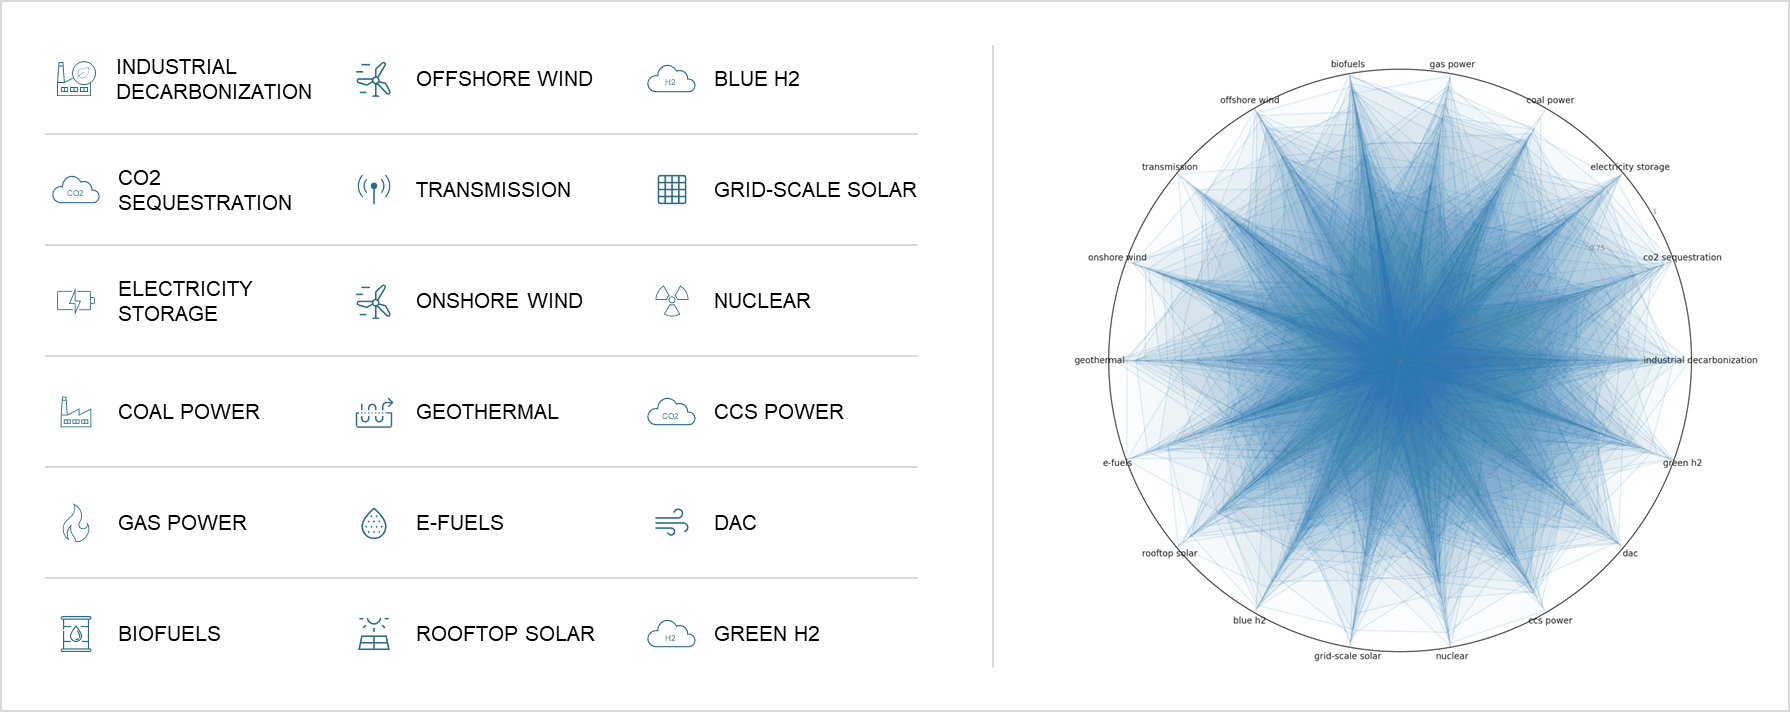
This is the focus of this new analysis. Using Ensemble, our next-generation modeling framework, we explore how the power system could evolve under the OBBBA compared with the trajectory set in motion by the IRA. Ensemble generates hundreds of economically and technically viable futures—each reflecting a different mix of resources and technologies that could credibly meet demand and reliability at near-optimal cost. This reveals not just what is likely, but what is possible.
Key Findings at a Glance
We employ a Modeling to Generate Alternatives (MGA) framework to explore a large ensemble of near-optimal system configurations under each policy. The resulting distributions of technology deployment outcomes represent structural diversity—not probabilistic forecasts—within the model’s feasible near-optimal space. Percentiles and medians are used descriptively to summarize this diversity across generated alternatives.
- Wind & Solar: Changes to tax credits materially constrain the economic opportunity for wind and solar but do not eliminate their deployment. Across the ensemble, the median scenario in the U.S. builds 985 GWs of new wind and solar through 2040; in the median OBBBA scenario we build 700 GWs. However, the downside risk of throttled industries is real, particularly for wind. In 20% of the OBBBA scenarios we build less than 125 new GWs of onshore wind and 2 GWs of offshore wind, beyond projects already under construction. In the 20th percentile IRA scenario, the U.S. still built 345 GWs of onshore wind and 15 GWs of new offshore wind.
- Geothermal: Under the IRA, the median scenario built approximately 16 GW of enhanced geothermal capacity by 2040, reflecting moderate technology cost declines and balanced incentives across renewables. Now under the OBBBA, which removes tax credits for wind, solar, and battery storage (without compensating supply chain adjustments), geothermal drastically expands. In the median scenario, deployment exceeds 30 GW of advanced geothermal within the next 15 years, and in 20% of modeled futures, capacity surpasses 70 GW by 2040.
- Nuclear: Under the OBBBA, in the median scenario, eight new nuclear plants are built, totaling roughly 2.4 GW (assuming 300 MW per unit). In the maximum scenario, deployment expands dramatically to more than 50 new plants, or around 16 GW of additional capacity. However, in 20% of modeled scenarios, new nuclear capacity does not exceed 1 GW, underscoring the need for additional policy support of new nuclear construction in order to ensure its deployment. Nuclear deployment occurs in thirteen states across the suite of runs: Florida, Maryland, Michigan, Minnesota, New York, North Carolina, Ohio, Pennsylvania, South Carolina, Virginia, Washington, Wisconsin, and Wyoming. The state with the maximum economic potential for nuclear deployment is New York, with up to 7.1 GWs deployed by 2040. That scenario coincides with the second lowest deployment of offshore wind, illustrating nuclear's criticality to meet the state's climate and energy goals if offshore wind deployment becomes untenable.
- Gas: Under the OBBBA and with high growth in data center load, utilities are often turning to gas. We have scenarios that span a rapid gas expansion (+35% gas capacity from today) to a 5% decline. Large gas expansion is not inevitable, but the substitutes for that gas expansion are not always what we commonly would anticipate under the IRA: renewables + storage. Our minimum gas capacity scenario is actually our highest coal scenario under the OBBBA, illustrating the importance of understanding the system-level impacts of resource decisions in this new policy environment. The states most likely to construct large amounts of new gas in our modeling are Texas and Virginia. Texas has a huge range in its near-optimal capacity buildout, with a difference of 20 GWs between its 20% (25 GW) and 80% (45 GW) buildout. Virginia has more limited options to satisfy new data center loads, with 15 GWs in its 20% buildout and 18 GWs in its 80% buildout.
Pulling Insights From Ensemble
As the findings above demonstrate, the Ensemble dataset supports “what-if” exploration—allowing us to test how changes in one technology trajectory shift investment in others and alter broader system dynamics. All of this can be uncovered without rerunning new scenarios.
Our team continues to expand and explore the Ensemble dataset to understand emerging trade-offs and system dynamics. Have a question or trend you’d like us to investigate? Reach out—we’d love to collaborate.
How To Use the Interactive
Explore the interactive below to compare outcomes through 2040 for the IRA versus the OBBBA using our Ensemble of optimization runs.
- Technologies: Select one or multiple power types. Values are additive when multiple are selected (e.g., Solar + Wind = combined capacity).
- Year Slider: Move between different projection years to see how capacity evolves over time.
- Scenarios: Toggle different policy/economic scenarios on or off to compare outcomes.
- States: Click on "States" to customize the selection for the state(s) of your choice.
- Hover: Hover over any ridge plot (hex tiles or aggregate panel) to see detailed statistics including value ranges, counts, min/max, mean, and median.
US ELECTRIC CAPACITY
Results do not include explicit state electrification or emissions goals that may influence deployment. They do include regionally aggregated CES targets.
Methodology
Ensemble is EER's implementation of Modeling to Generate Alternatives (MGA), a powerful extension of traditional optimization approaches used in energy systems modeling. Instead of identifying a single least-cost solution, MGA introduces a structured way to explore the space of near-optimal solutions — those that perform nearly as well as the best solution but differ significantly in their composition or structure. The process begins with a standard optimization to establish a baseline objective (e.g., minimizing total system cost). That objective is then converted into a constraint, typically allowing a small relaxation (for example, 1% above the optimal cost), which defines a feasible envelope of acceptable solutions. By introducing new objective functions that emphasize variation in technology mix or resource use, MGA encourages the model to uncover diverse system configurations that still meet economic and technical criteria. This method effectively transforms optimization into a tool for exploration rather than mere minimization, revealing the multiplicity of viable energy futures that satisfy similar cost thresholds.
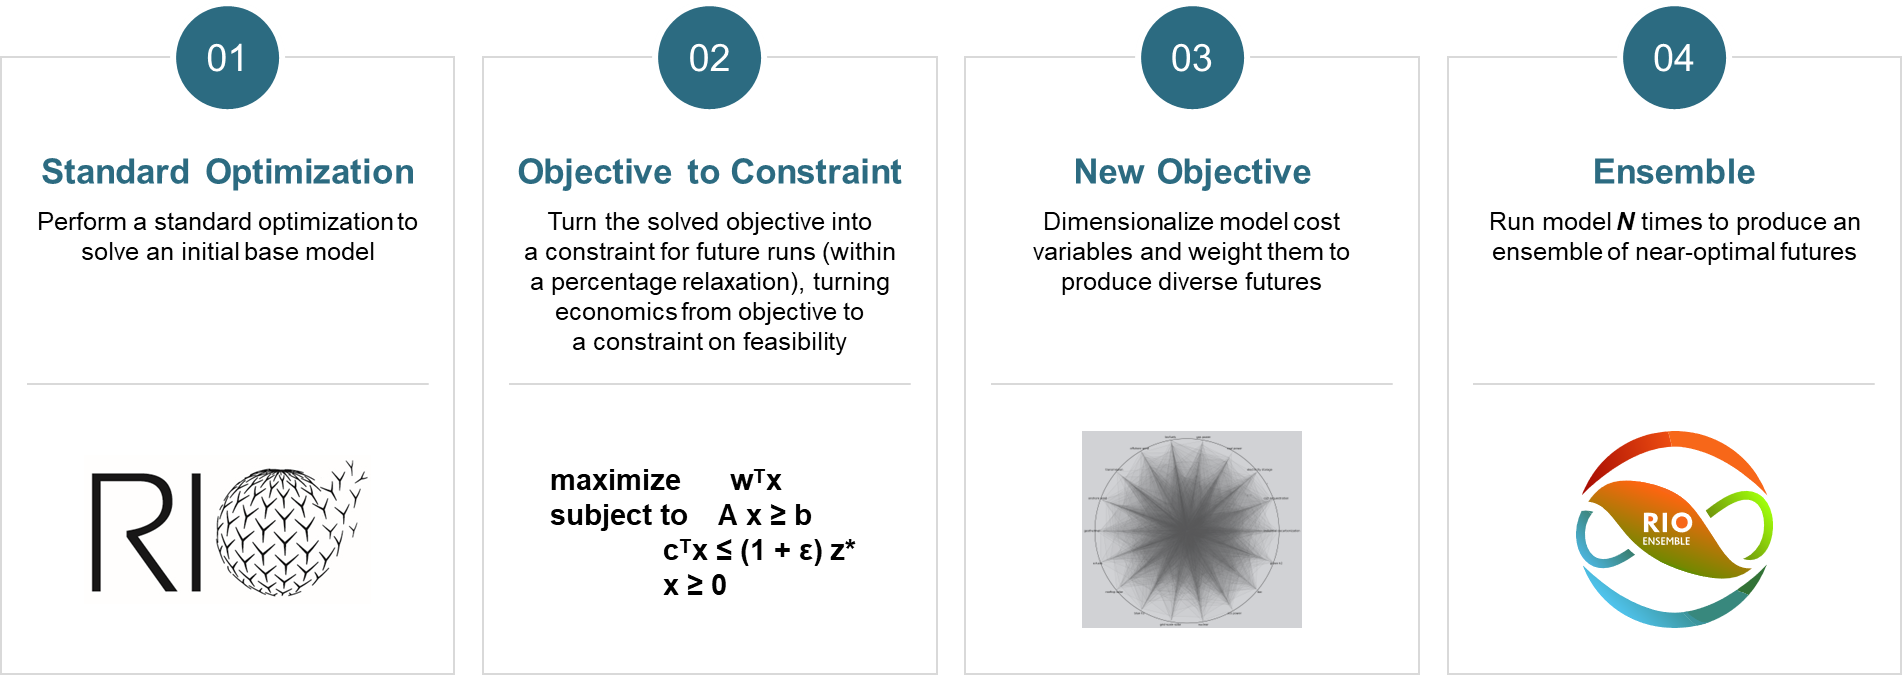
Ensemble modeling builds on MGA to create a systematic, computationally driven framework for generating and analyzing large sets of these near-optimal futures. Through iterative MGA runs—each weighted differently across key dimensions such as renewable deployment, firm capacity, or transmission investment—an Ensemble approach produces hundreds of unique yet economically comparable solutions.
This collection of scenarios captures the inherent uncertainty and flexibility in system design, allowing researchers and policymakers to identify recurring features and robust investment patterns that persist across diverse pathways. The result is a richer, more nuanced understanding of energy transition dynamics—one that moves beyond the narrow focus on a single “optimal” future to instead highlight the range of credible and resilient system configurations available for decision-making.