The Life and Death of a Well-Traveled Shrimp
(and Accounting for its Embodied Carbon)

Principal Jeremy Hargreaves, who leads much of Evolved’s state-level work, explores embodied carbon and carbon leakage ahead of the release of Washington's first Consumption Based Emissions Inventory (CBEI). Told through the travels of a shrimp, this primer on embodied carbon and CBEI is a useful guide for anyone seeking to understand why embodied carbon is important, the blind spots in conventional carbon accounting, and the opportunities of new tracking and accounting methods. You can read the article and view our AI generated explainer video below, or download the pdf of the article at the bottom of the page.
Evolved Energy Research has been a consistent leader in long-term decarbonization planning across international, national, state, and regional contexts. With robust modeling and analytically grounded approaches, we support policymakers in developing durable, actionable climate strategies.

In the book Feed the Planet1, Michael Pollan describes the interesting travelog of a shrimp and its emigration to a shelf in Costco in his foreword. Raised in the Bay of Bengal, the shrimp is fed pellets containing anchovies from Peru and soybeans grown on land cleared of Amazonian rainforest. Cargo ships deliver shrimp feed over thousands of miles from South America to Asia and eventually deliver the shrimp itself to an arrival port in America before transfer to a truck, a Costco shelf, and the last mile to your refrigerator.
The Costco shrimp is not unique. Toy Story conversations in your refrigerator and closet would be spoken in multiple languages, sharing similarly complex journeys. Among those are American voices as well, coming from American fields and factories, but in many cases including inputs from elsewhere. The recent media crash course on tariffs and global supply chains in the US highlighted this in the auto industry in particular, where many of the parts of a made-in-America vehicle are manufactured in Mexico or Canada and the onboard microchips in Taiwan or China.
At each step of feeding, raising, and transporting the shrimp, there are fuels consumed, fertilizers used, and perhaps even rainforest cleared - all contributors of greenhouse gas emissions. These lifecycle emissions associated with raw material extraction, production, and transport along all steps of the supply chain are known as embodied carbon. All food, clothes, and other products have them. Services have them. Consuming shrimp or any other product or service contributes to your carbon footprint in ways we as consumers are often unaware of.
For places with emissions reduction targets, tracking those emissions is hard. The Costco shrimp has been fed, raised, and transported across several countries, many of which lack the data to determine emissions precisely. Sources of emissions include energy inputs like fuel in cargo ships but also nitrous oxide from fertilizer and the shrimp ponds, methane from waste decomposition, and land use change from mangrove to aquaculture and rainforest to farmland. Identifying and quantifying those emissions inputs would be difficult in the shrimp example, and other supply chains can be even more complicated.
But tracking those emissions, or at least estimating them, is like closing a loophole - one that, while open, can send the wrong signals to homes and businesses. States with emissions targets track the emissions of a locally raised shrimp. Source them out of state or internationally though, and the emissions are not counted, shifting the emissions burden to another entity, in many cases to states and countries where emissions are uncontrolled. This effective outsourcing of emissions means that current state emissions targets are incomplete. Purchase a Costco shrimp instead of a local shrimp and tracked emissions decrease in an emissions-controlled state, assuming that purchase decision reduces activity of your local shrimp business (if you have one) and emissions from that business contribute to the state’s emissions inventory. But switching to a product with a more emissions intensive supply chain from a region without carbon controls would increase emissions overall. This effect is known as “carbon leakage.”
Carbon leakage can undermine carbon policy. Imagine a Costco shrimp purchased in Washington State in 2030. Washington has set the most stringent emissions targets in the nation, and in just the next 5 years, must mainstream a nascent clean fuels industry to get there2. Producing clean fuels to substitute for gasoline, diesel, or jet fuel can be expensive. At the same time, fossil fuel emissions and process emissions (and potentially even cleared rainforest) are hidden in the untracked embodied carbon of imported products. Taken to extremes, when targeting net-zero emissions in the future, this loophole could lead to high-cost measures to remove carbon from the atmosphere like direct air capture on the one hand, while continuing to consume imported products with coal, oil, or emissions intensive land use change as an inputs to their supply chains on the other. If high carbon prices from local controls drive more imports of untracked embodied carbon (carbon leakage), states could shift some emissions to other places rather than having the opportunity to reduce them locally.
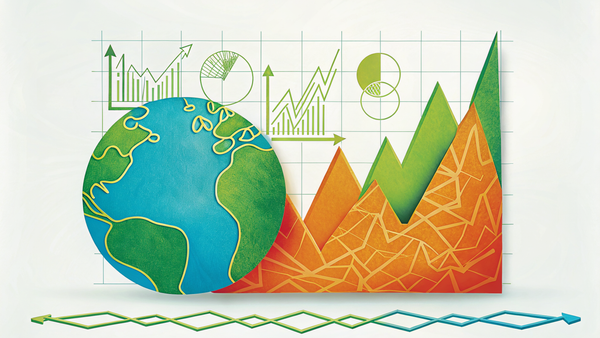
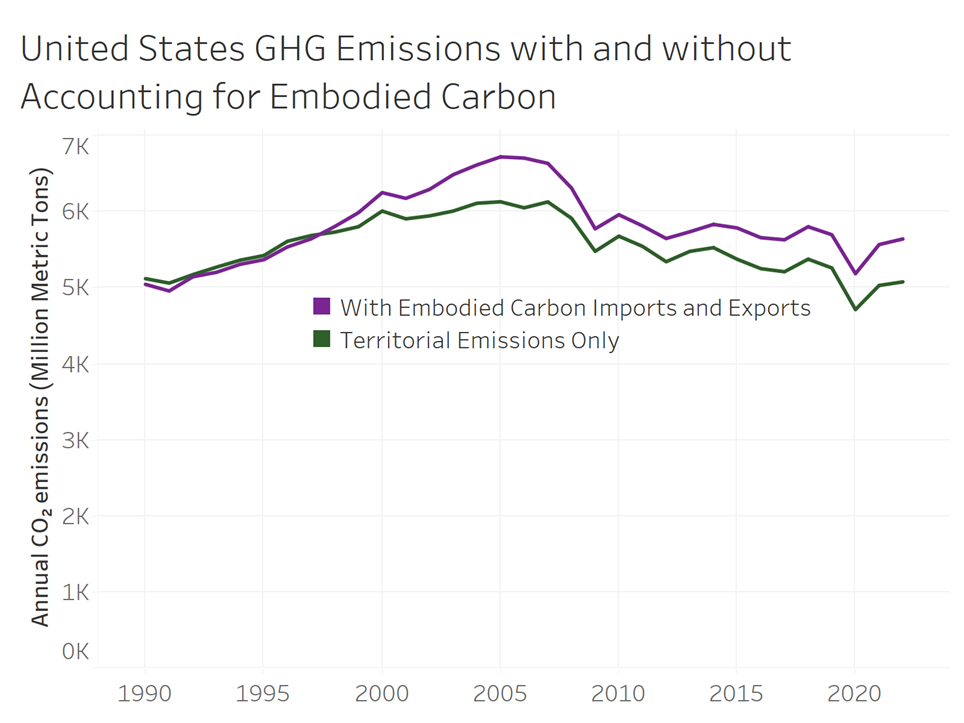
US emissions including embodied carbon in imported and exported goods were 11% higher than counting territorial emissions alone in 2022 (Figure 1)3. KGM & Associates and Global Efficiency Intelligence in their 2018 report "The Carbon Loophole in Climate Policy"4 estimated that about a quarter of global emissions are in embodied carbon from imported goods and those are largely hidden from carbon accounting in regions with greenhouse gas emission controls. Ominously, they report the findings of a study by Kanemoto et al.5 that global air pollutant emissions, such as NOx and SOx have continued to rise, despite strong controls in the US and Europe – an example of increased outsourcing of emissions that could foreshadow a similar effect on GHG emissions as carbon controls become tighter in some parts of the world.
At a state level, the mismatch between emissions with and without embodied carbon can be even greater. Some states have large markets for goods and little industry, and for others it is the reverse. The EPA unveiled new tools to calculate embodied carbon and analyzed the difference between emissions with and without embodied carbon in their 2024 report7. Figure 2 shows emissions produced locally and covered by state emissions policy versus emissions including embodied carbon. The latter are described as consumption-based emissions (CBE) because they are concerned with the energy, goods, and services consumed within a state.
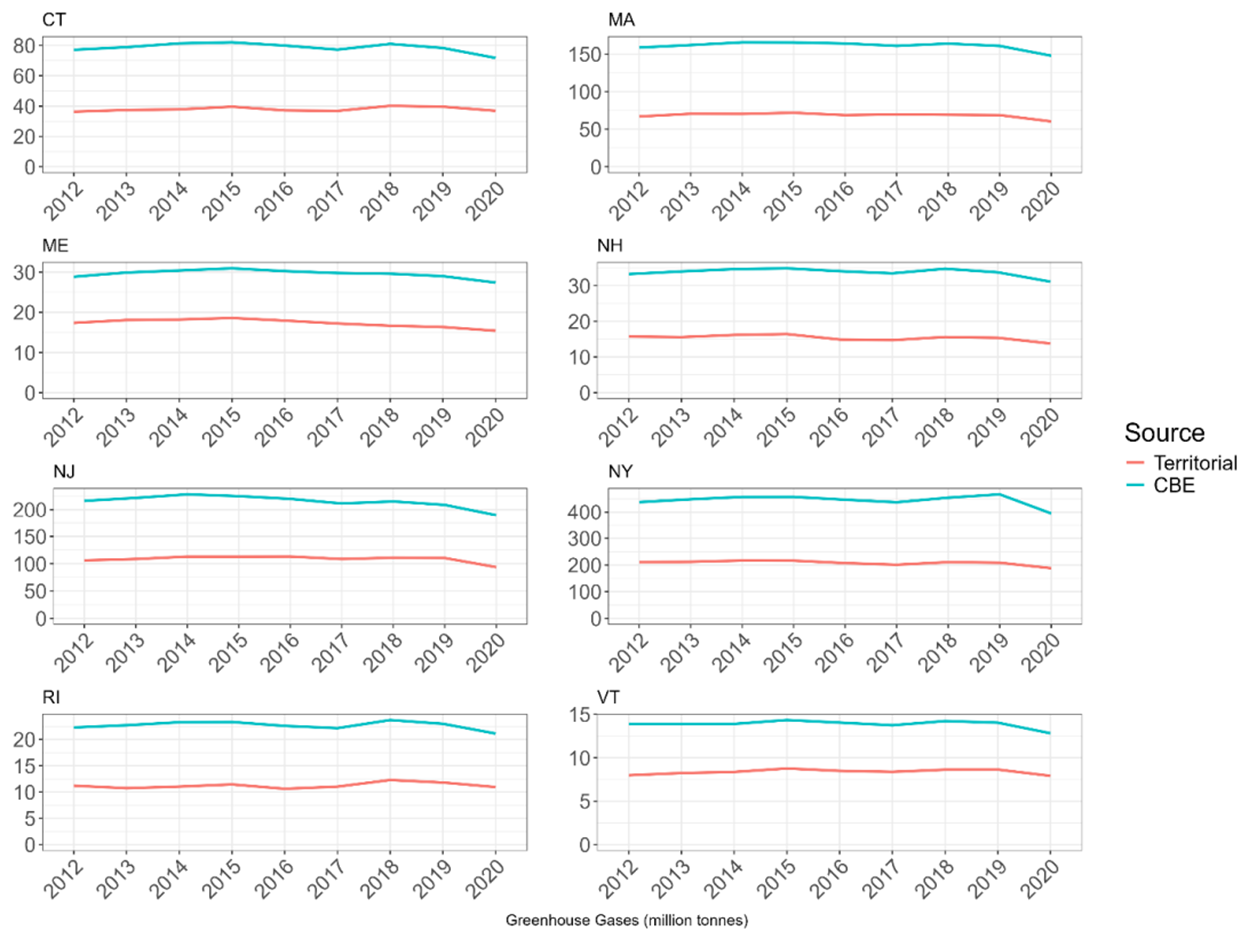
These states all have limited production of emissions locally relative to the size of their markets for imported goods, reducing their emissions burdens if basing targets on territorial emissions relative to their consumption. By closing the loophole, these states would increase their emissions inventories while also increasing the options available to reduce emissions. The mismatch can go the other way as well. Figure 3 shows the mismatch between consumption-based and territorial carbon emissions for select countries. If carbon is controlled without accounting for embodied carbon in imports and exports, some shoulder less emissions responsibility than their overall consumption and others shoulder more.
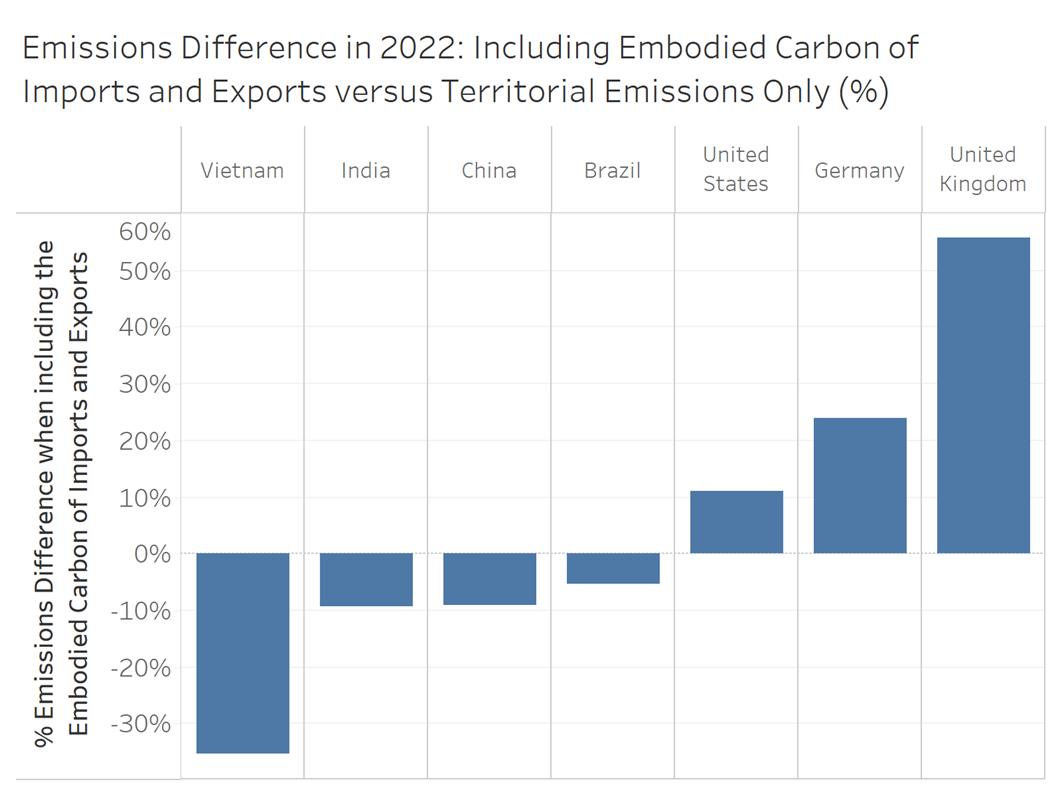
This illustrates why regulating territorial emissions alone raises questions of equity. Vietnam, for example, has a large export economy, producing for the rest of the world. Emissions targets that include territorial emissions from exports to other countries place the burden on the producer rather than the consumer even though demand from the consumer is driving the emissions in the first place. These same challenges exist at a state level as well. For example, should a farming state like Montana bear the full emissions responsibility for their agricultural production even though most of its produce is consumed in other states?
Just as carbon leakage can threaten local industry in carbon-regulating regions, it can also make implementing climate policy in export-orientated economies self-defeating. Much of Vietnam’s emissions, for example, are exported to other counties such as the United States and United Kingdom in the form of embodied carbon. If the importing country regulates only territorial emissions (or has no emissions regulation), any increase in production costs in Vietnam associated with carbon controls may drive away business to less regulated countries, threatening their economy.
Even without carbon leakage, the disconnection between the consumer and producer can theoretically lead to increased costs to achieve the same amount of carbon reduction. In Montana, for example, about 50% of their emissions come from agricultural non-CO2 emissions including methane from cows and nitrous oxide from fertilizer usage. If they had an emissions target, they could replace all their coal and gas power with wind and solar and fully decarbonize their fuel use in vehicles and airplanes with clean fuels, and still they would have only reduced their emissions by 50%. The options for reducing agricultural emissions are limited. There are some changes to agricultural practices possible such as different feed or feed additives for cows or changing fertilizer practices, but emissions will remain. Consumers could switch consumption to lower carbon intensity foods. This could happen if carbon intensive foods became relatively more expensive due to carbon reduction measures or through direct policy interventions. But when those consumers are largely outside a state’s borders, they are more likely to switch to another lower cost supplier – a threat to local agriculture, just as in the Vietnam example. Reaching net zero technologically would take expensive carbon dioxide removal technologies (CDR) like direct air capture. To decarbonize territorial emissions at the same rate as other economies with carbon targets in the United States, Montana would require the early deployment of these technologies at a significant cost. This is one finding from the Net Zero Northwest Study from the Clean Energy Transition Institute that investigated as a thought experiment the question “what if all states in the Northwest were to achieve net-zero emissions?”10
Accounting for territorial emissions and ignoring embodied carbon makes achieving emissions targets easier in states with larger populations of consumers relative to production output, and, vice versa, harder in states with smaller populations relative to production. The fact that agricultural emissions are some of the hardest to reduce (assuming little change in people’s diets) amplifies this contrast in states and countries with large agricultural exports.
Those with higher incomes generally consume more imported products. On average, middle-income countries are exporters of embodied carbon and high-income countries are importers. The richest countries have larger carbon footprints per capita than the poorest. Estimates from the Stockholm Environmental Institute and Oxfam put the emissions of the richest 1% of the world’s population at equal to the emissions of the poorest 66% in 201911. By outsourcing emissions and not tracking embodied carbon, those with the highest incomes are shifting the responsibility of dealing with those emissions to those with lower incomes. This effect would be exacerbated if carbon controls were to increase imported embodied carbon via carbon leakage.
So far, the story of the shrimp suggests that not counting embodied carbon is a failure of policy. In fact, targeting local emissions and targeting proxies for emissions reductions like clean electricity have driven significant action towards cleaner sources of energy. Tracking local emissions is simpler to do, has less uncertainty, and, because actions happen within state borders, ties more closely to things within the control of the target setting region. As measures to reduce carbon go beyond the economic low-hanging fruit in the future though, there is greater risk of leakage and missed opportunities for cheaper carbon reductions.
At present, there are no states in America that count embodied carbon when meeting statutory emissions reductions targets but some states are tracking it or taking parallel action to control it. The next section describes the carbon accounting mechanism states currently use for statutory carbon targets: production-based emissions inventories (PBEI), and the alternative mechanism that includes embodied carbon: consumption-based emissions inventories (CBEI).
Recognizing and tracking these emissions as part of the carbon footprint is the first step, but what options do we have to reduce them? It may be tempting to think the solution is local production. But this misses out on the huge economic benefits that global trade has provided and the reason why we have a globalized economy today. Some emissions, such as from transport may be hard to remove from long supply chains, but other input substitutions may be achieved more easily and cheaply. Quantifying embodied carbon can send economic signals to produce products with this previously untracked quality, allowing producers to adapt their products and for markets to identify the lowest cost options for emissions reductions.
There are challenges to achieving this though, including uncertainty, complexity of tracking, establishing commonly accepted frameworks, implementation policy within carbon-controlled states, international trade policy, fraud, and political opposition. There are good arguments for the relative simplicity of PBEI – an achievable policy is better than a perfect but unachievable policy. However, there are tools, policies, and new technologies under development that will help overcome some of these challenges and make CBEI more achievable. Section 2 explains PBEI and CBEI in more detail. Section 3 looks at present day approaches to tracking embodied carbon and new approaches under development. Sections 4 look at public policy options for CBEI or hybrid approaches of PBEI and CBEI that incorporate embodied carbon. Section 5 looks at how corporations are committing to reducing their emissions.
Accounting Methods: Production-Based vs. Consumption-Based Inventories
Production-based accounting tracks emissions generated within a state's own geographic boundaries. Under this framework, emissions from local factories, power plants, vehicles, agriculture, and waste management facilities are counted. This method has the advantage of simplicity, making emissions relatively straightforward to measure and verify. These are strengths of PBEI identified by the Intergovernmental Panel on Climate Change (IPCC) guidelines for National Greenhouse Gas Inventories12. Those guidelines are production-based and designed to ensure comparability across countries – key for international agreements. CBEI will require standardization in reporting and uniform guidance in implementation for international agreements to be based around it.
But production-based accounting misses pieces of the emissions puzzle. Consume a shrimp raised and fed entirely within your own state and the emissions are counted in the inventory, but import a shrimp from overseas and it is effectively treated as carbon free. The same is true of all goods, energy, and services imported from outside the state. Conversely, produce a shrimp exported for consumption elsewhere and the emissions of producing that shrimp are still counted in the inventory, as are the emissions of anything produced geographically within the state's borders. This is illustrated by the Venn diagram below, taken from EPA's recent report on consumption-based emissions inventories in the Northeastern United States.
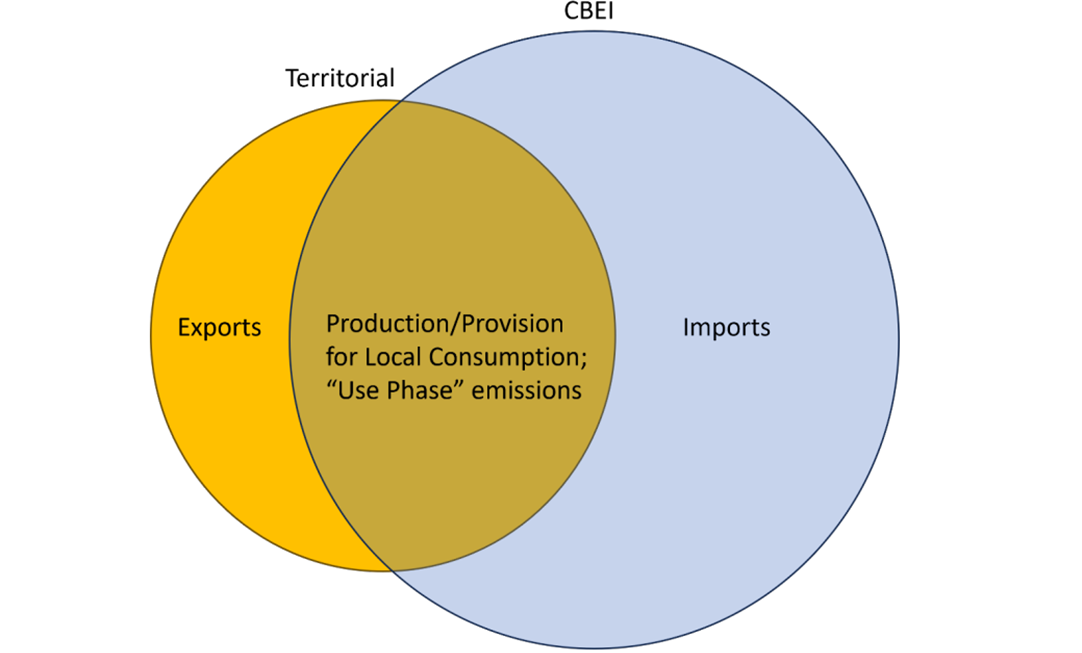
Production-based, or territorial emissions in the above chart, don’t include imported emissions and account for exported emissions. Both of these shortcomings can lead to distorted incentives for carbon action that push to producing fewer products within state and consuming more from out of state. To achieve emissions reduction goals, states take measures that put an implicit or explicit price on carbon. Implicit through regulations that curb carbon dioxide production, such as clean energy targets for electricity or electric vehicle targets for car manufacturers, or explicit through carbon allowances or taxes, such as the Washington State Climate Commitment Act (CCA) that caps GHG emissions. The benefit cost analysis of new industry deciding whether to locate in one state or another also includes these costs. Likewise, if carbon intensive industry within a carbon-controlled state has the option to move elsewhere, the cost of carbon may be a driver of doing so. Losing industry in this way is known as "carbon leakage," where emissions-intensive industries relocate to places with fewer regulations or import goods produced with higher emissions elsewhere. Another form of “carbon leakage” comes from the everyday choices consumers make between products. Consumers free to choose between goods with supply chains that don't face carbon costs versus those that do will often go with the lower cost option, increasing production out of state and lowering it within state.
Consumption-based accounting evaluates the total emissions related to all goods and services consumed within a state, no matter where those goods were produced. This method accounts for emissions embedded in imports such as manufactured products, electricity, food, and building materials, providing a fuller picture of a state's actual carbon footprint. The state where the shrimp is eaten would be responsible for the embodied carbon rather than the state, country, or countries where it or its food is grown.
The primary advantages of consumption-based accounting are to allocate responsibility of emissions to those supporting supply chains through consumption choices and its ability to reduce incentives for carbon leakage. It doesn't matter where a shrimp comes from, if it is eaten in a state with consumption-based accounting, its embodied carbon contributes to the state consumption-based emissions inventory. In practice, this manifests in recognition of, or increased prices for, goods with higher carbon content so that customers and governments can make more informed decisions. By holding states accountable for their full consumption patterns, it encourages sustainable supply chains.
In the Vietnam example given in the introduction, Vietnam would be incentivized to produce cleaner products to compete in carbon-controlled markets using CBEI. In contrast, if Vietnam were to implement carbon controls while selling into markets using PBEI, they would risk losing business to lower cost producers14. State led mechanisms to track embodied carbon and incentivize its reduction can help control carbon leakage and encourage cleaner supply chains.
However, its implementation poses challenges, as it requires detailed and reliable data about complex global supply chains to track emissions. It does not yet align closely with standard international reporting protocols, creating potential issues in comparability and consistency. And legally, there are restrictions by region on the type of emissions regulation of goods that can be implemented.
Tracking Embodied Carbon
CBEI sounds great in concept until you start thinking about how to do it for all products entering and exiting a particular emissions-controlled region. The Costco shrimp is a good case study. Where are the data for the emissions of agricultural fuels consumption, fertilizer use, land use change, and transportation across the various countries in the supply chain? Who verifies that data? What safeguards are there against fraud? Who standardizes procedures for emissions reporting or for the CBEI accounting method itself? Do this for all products entering and exiting a territory and the data and verification requirements become significant. This covers collection and verification of data. Controlling emissions introduces more complexity and the mechanisms available to implement controls will vary by region, for example whether it’s a US state bound by the Interstate Commerce Clause, a nation, or a group of nations like the European Union.
Shrimp aquaculture is not a low carbon food source and can vary widely in carbon intensity depending on where it takes place and what its inputs are. Carbon intensities range from 2 to 80 kgCO2e/kg edible weight with an average of 13.5 kgCO2e/kg edible weight according to a literature review by the World Wildlife Fund15. For reference, beef ranges from 16 to 360 kgCO2e/kg edible weight and averages 76 kgCO2e/kg edible weight16, whereas aquaculture raised mussels have a carbon intensity of about 1 kgCO2e/kg edible weight17,18.
The largest contributor to where a particular producer falls in this range is land use change. If shrimp aquaculture uses ponds cleared of mangrove trees, their emissions intensity can be an order of magnitude higher than if using other types of pond. One study estimated emissions intensities in Vietnam from cleared mangrove areas at 184 kgCO2e/kg shrimp from the amortized release of locked up carbon19. About 12% of mangrove cover was destroyed by shrimp aquaculture in Asia between 1975 and 2005, and about 5% of Indian shrimp are raised on previously mangrove areas20. Our particular shrimp raised in the Bay of Bengal is unlikely to have been though. Mangrove coverage has grown in the region since 1999 and stricter environmental regulation has prevented the majority of new aquaculture impacting mangrove coverage21.
The other large contributor to the range is the type of land used to grow feed for the shrimp. The majority of shrimp are fed a diet of anchovy pellets from Peru, responsible for 18% of global fish meal production between 2013 and 202322, and soy or wheat, in our shrimp’s case from deforested Brazilian rainforest. A WWF literature review of soybean lifecycle emissions puts emissions intensity for these soybeans at 15.7 kgCO2e/kg23 due to land use change.
How were these numbers calculated? Firstly, the shrimp supply is broken down into its component parts. This can easily produce a very complex web of disaggregated steps in the chain (Henriksson et al.24 provides a generalized aquaculture supply chain diagram) but for our purposes we will focus on the aggregated steps WWF laid out in their literature review of shrimp supply chains (Figure 5).
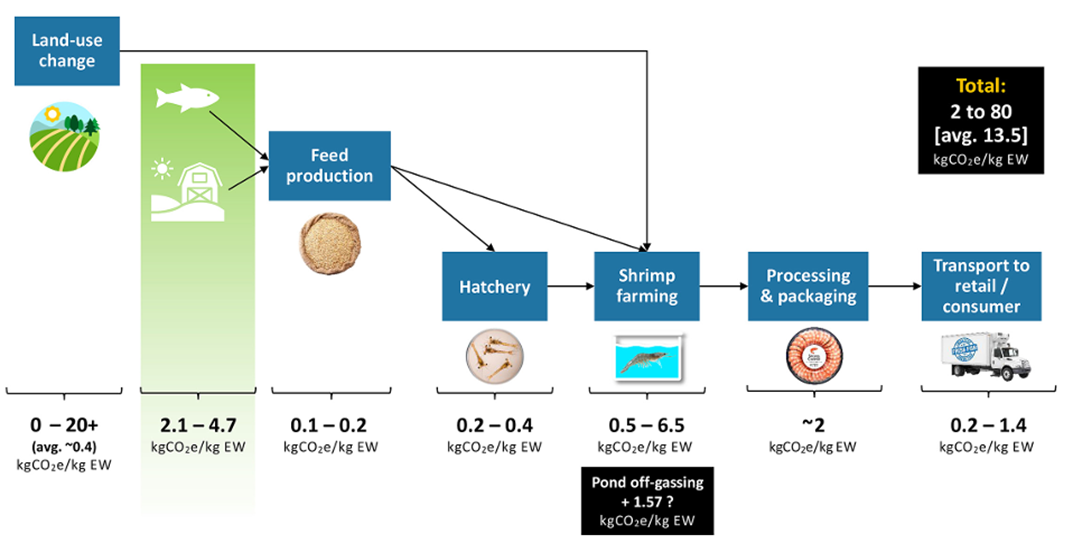
The overall total from WWF ranges widely from 2 to 80 kgCO2e/kg. This is highly dependent on land use change – whether mangroves, rainforest, or other large carbon stores were released in either the aquaculture or feed steps in the chain. There lies a potential problem for CBEI. Shrimp at the upper and lower end of this range could come from the same region, it all depends on farm specific factors. Without granular tracking of the supply chain of each shrimp, we lose these details.
Currently, CBEI studies typically rely on emissions factors for imported goods that are 1) aggregated, losing differentiation between sources of imported goods, and 2) static, not accounting for the opportunities to clean up the supply chains of imported goods. This works for a CBEI for past years where an average emissions rate of the goods imported will give a reasonable estimate of embodied carbon.
However, approaches that use aggregated and static emissions factors for goods will tend to favor local solutions when planning for future emissions reductions. This is problematic. It may be very hard or very expensive to produce a particular good locally, whereas it may be much easier and cheaper to reduce embodied carbon in imported goods. This requires identifying the opportunities to reduce carbon in import supply chains, the cost of doing so, and the challenges of implementation. Verification of reported emissions reductions becomes particularly important.
Even with aggregated and static emissions factors, the challenge of calculating, verifying, and reaching agreement is formidable. Data, models, and design choices are made within each step of the supply chain to estimate emissions. Given the varied nature of the activities, including farming, fishing, aquaculture, processing, and transport in the shrimp example, this spans a variety of specialized datasets and industry specific expertise. Examples of models and data sources that could be used in these steps are given in the table below.
| Data Source | Description |
|---|---|
| ecoinvent / Agri-footprint | LCA data for agriculture, fishing, feed |
| Trase, GRAIN, or SEI | Land-use change emissions (Brazil soy) |
| FAO GLEAM | Emissions from aquaculture and livestock |
| GREET model (Argonne) | Transportation emissions |
| IPCC Guidelines | Land-use change and default emissions factors |
To build CBEI into emissions targets, a lot of responsibility would fall on these datasets and standardization would be needed. There are also choices to be made regarding methodology. The International Standards Organization (ISO) has guidelines for these choices in ISO 1404426.
Aquaculture in general is a good example of a product class that is almost entirely imported into the US and Europe. It accounts for over half of all seafood for human consumption and continues to grow rapidly, increasing output by about 3.5%/year over the last decade27. Yet 92% of all aquaculture raised seafood comes from Asia. While there are economic and employment benefits of developing local industry, prices may be higher or the environment may be unsuitable for significant scale. Evaluating the opportunities for cleaning up supply chains in imported goods may save money and would be a component of an ideal planning process involving CBEI.
CBEI studies to date have relied on extensive analysis of past years, providing an after-the-fact assessment of consumption-based emissions. For policy and actionable measures that reduce consumption-based emissions, opportunities for reducing embodied carbon and their costs need to be built into forward looking planning, and signals that allow choices to be made in real time are necessary. To do this, policymakers, planners, and consumers need more information about embodied carbon to be able to choose what policy measures a state should pursue, or what product to buy factoring in their emissions as well as their other attributes.
In the shrimp example, that could involve sourcing shrimp from aquaculture without large land use change emissions or adopting cleaner farming practices. Methods of carbon tracking and verification that could differentiate between clean and dirty product options are emerging. These include:
- Environmental Product Declarations (EPDs). These are third party verified documentation of life cycle GHG emissions from a product. There are standards developed for this too, including ISO28 and UL29, based on Product Category Rule (PCR) guidelines specific to the region tracking emissions. Verification is carried out by independent certification bodies, which is costly and takes time. Currently, these are limited to high-value or high-emission products. The steps of the supply chain at which EPDs are required can also be limited. For example, the fabrication stages of structural steel and concrete reinforcing steel are relatively low as a percentage of overall product supply chain emissions. These are often carried out by small or medium sized businesses that would find the EPD cost burdens onerous, (California, for example, does not require their inclusion in their program)30.
- Customs Declarations of Carbon Intensity. The EU Carbon Border Adjustment Mechanism (CBAM) pilot covers cement, steel, aluminum, fertilizers, electricity, and hydrogen. This requires importers to submit information on the origin, production method, material composition of goods, and verified embodied emissions if those are available. If emissions are not submitted, it uses default emissions factors from the European Commission, and may be set conservatively high to incentivize accurate reporting. Submitted emissions values are enforced with spot audits.
- Digital Product Passports (DPPs) and Blockchain. DPPs are a digital record of product information that accompanies an imported product. The EU Battery Passport31, required for all imported batteries from 2027 onwards, is a good example of this. It will require product information, lifecycle carbon emissions, material sourcing, recycled content, battery performance, and recycling instructions. While the EU Battery Passport is technology agnostic, it is an ideal application for blockchain technology. All stages of the supply chain are tracked through the DPP. In the EU Battery Passport case, every batch of lithium, cobalt, nickel or other battery metals would include registration on a blockchain, or other digital passport solution, listing embodied carbon. The manufacturing stage would then add process emissions and emissions from energy inputs, and on through the supply chain. The battery DPP would be linked to the vehicle or other technology it ends up in.
Policy Approaches Incorporating CBEI
Currently, there are very few examples of comprehensive CBEI in practice. States and municipalities such as Oregon, Minnesota, Seattle, and San Francisco have begun exploring or adopting consumption-based inventories to guide more comprehensive climate policies that happen in parallel to state production-based emissions inventories. Washington is working on publishing their first. The challenges to basing statutory emissions targets on CBEI are such that it’s unlikely states or countries will switch to CBEI alone, though a well-developed ecosystem around digital passports or other tracking mechanisms in the future will make CBEI based policy more accessible.
More likely is a hybrid approach that accounts for some of the elements of CBEI within a PBEI framework, supplemented with other policy initiatives. Recognizing the challenges with using production-based emissions inventories only, some states and countries have already adopted hybrid approaches in meeting their statutory carbon targets. They still use production-based emissions accounting but have implemented policy measures that approximate embodied carbon in some sectors of the economy. This is common for electricity.
Electric systems that cross state borders are well understood machines with large amounts of up-to-date data. One hybrid approach to incorporating CBEI for electricity is through cap-and-trade programs such as in California and Washington. Contracted deliveries of electricity imported into these states must surrender carbon allowances for their emissions. Unspecified power receives a default emissions factor (0.428 tons CO2/MWh, based on the average emissions intensity of the Western grid). These states remain production-based for instate generation though. For example, gas power exported from Washington to Oregon must surrender emissions allowances in Washington.
A similar approach is taken by the European Union, using a Carbon Border Adjustment Mechanism (CBAM) that imports specified emissions associated with electricity if they are available or applies a default carbon intensity if not. Emissions from exported electricity still remain in the EU emissions inventory.
These approaches are not truly consumption based, holding both the emissions from imports and exports in the inventory. It puts companies within the EU on a level playing field with companies outside of the EU when selling into local EU markets, but could impact competitiveness of EU companies when exporting to regions without emissions controls. While technically regulating more emissions, reducing competitiveness of EU companies may result in carbon leakage. Large EU exporters may relocate outside the EU or lose market share because of competition in non-EU markets from higher carbon competitors in regions with unregulated emissions.
The CBAM in the EU is applied more broadly than just to electricity, including cement, steel, aluminum, hydrogen, fertilizers, and electricity, hybridizing PBEI with CBEI across more parts of the economy and preventing carbon leakage32. There is no reciprocal reduction in emissions for exports in any of these categories, but a border carbon adjustment could be designed to include this. As discussed previously, reciprocal adjustments could protect large export economies and prevent potential double counting.
Parallel policy initiatives to PBEI can further strengthen efforts to manage embodied emissions. A first step is to require disclosure of embodied carbon in products. There are several programs that require disclosure, including Buy Clean and related programs in California, Washington, Colorado, Oregon, Minnesota, New York, and New Jersey, and the Ecodesign for Sustainable Products Regulation (ESPR) in the European Union. This is achieved through requiring EPDs or digital passports. In US states with these programs, EPDs are required for building materials. The EU ESPR has the most expansive regulation in this area, requiring digital passports for almost all products, excluding only food, feed, and medicinal products33. By making public the embodied carbon of different product options, consumers have information to make a more informed choice.
Carbon intensity standards build upon product disclosures. The "Buy Clean" program in California is an example. Beginning in 2017, it initially required only product disclosure for building materials through EPDs. In 2022, it moved to include procurement standards requiring low-carbon materials for public projects based on emissions intensity limits, incentivizing suppliers to reduce embedded emissions. Washington has a similar program called “Buy Clean + Buy Fair” that includes a broader range of building materials and adds additional labor requirements for manufacture of those materials. Availability of EPDs was an initial challenge for the California program that was the first of its kind, beginning in 2017. By establishing an EPD ecosystem for public projects, these types of programs could be potentially expanded in the future. In the United States, the Interstate Commerce Clause is designed to prevent any discrimination against out-of-state products. Policies must therefore be location-neutral. For example, carbon intensity standards must be applied to all products, regardless of origin, and EPDs should employ standardized guidance.
Buy Clean falls within a broader category of Green Public Procurement (GPP) that is applied in various forms around the world. These are not always greenhouse gas focused, including other environmental criteria. Examples of GPP include: EU GPP34, a voluntary program (though some countries have made some types of green public procurement mandatory), that covers a more expansive list of products than Buy Clean; and Japan’s Act on Promoting Green Procurement, established in 2000 and mandatory, suppliers must demonstrate compliance through Japanese eco-labels. EU GPP includes embodied carbon requirements for building materials and Japanese GPP has no requirements at present, though is likely to move towards explicit carbon thresholds in the future35.
Extending beyond the public sector, ESPR in Europe sets the stage to limit carbon intensity of almost all products in the EU. By requiring digital passports and establishing the infrastructure for manufacturer compliance, reporting, and verification, the ESPR will be the mechanism by which future regulation on product emissions and sustainability across all EU markets is enforced.
Finally, Extended Producer Responsibility (EPR) provides another policy tool for regulating emissions. EPR focuses on end-of-life management for products and traditional EPR programs have focused on reducing waste. Examples include programs to recycle content from packaging, electronics, batteries, vehicles in the EU, and managing refrigerants. Adding a carbon focus means carbon intensity will be added to program performance criteria.
| Policy Mechanism | How It Reduces Embodied Carbon | Examples |
|---|---|---|
| Border Carbon Adjustments (BCA) | Applies carbon pricing to imports | EU CBAM |
| Mandatory Embodied Carbon Disclosure | Creates transparency, enables product comparisons by consumers | California, Washington, Colorado, EU ESPR |
| Carbon Intensity Standards | Sets emissions intensity limits for materials and products | Buy Clean programs in California and Washington, EU ESPR |
| Green Public Procurement (GPP) | Public procurement policies focused on criteria of sustainability with development of emissions intensity limits for future iterations | EU GPP, Japan, U.S. state programs |
| EPR with Carbon Focus (Emerging) | Deals with end-of-life product management and puts lifecycle carbon responsibility on producers | In development in EU, Canada |
Corporate Action towards Controlling Emissions
So far, we have talked about state led action towards embodied carbon but there are reasons to decarbonize as a producer even without states tracking or controlling the carbon content of products. For one, reducing emissions can be aligned with reducing production costs, for example when companies switch to the latest and most efficient technologies or processes or energy audits reveal opportunities for cost savings. Companies can gain first-mover advantage in anticipation of future regulations that might drive preemptory emissions reductions. The power of brand among consumers can also differentiate products based on qualities they care about. If two products are close to the same price (or not, depending on the strength of consumer preferences), we will often choose the producer that uses natural ingredients, sustainable materials or packaging, or commits to clean energy or emissions reductions. These qualities of a product or reputation of the producer weigh on company value and many companies have made voluntary commitments to emissions reductions.
Corporate emissions fall into 3 categories. These are scope 1, scope 2, and scope 3, originally defined in the WRI and WBCSD GHG Protocol36:
| Scope | Definition and Example |
|---|---|
| Scope 1 | Direct GHG emissions from sources that are owned or controlled by the company, e.g., emissions from farming activities at shrimp aquaculture facilities |
| Scope 2 | Electricity indirect emissions from the production of electricity used by the company, e.g., electricity consumed at the farm |
| Scope 3 | Indirect emissions attributable to company activities but from sources not owned or controlled by the company, e.g., emissions from shrimp feed production upstream in the supply chain |
Across the three scopes, the same emissions that would be accounted for in consumption-based inventories are covered at a company level. Scope 3 represents the supply chain related emissions that are challenging to address for states and are the hardest category for corporations to address as well.
Frameworks that help track, target set, and/or validate emissions reductions across these scopes can help companies demonstrate action and instill confidence in investors and consumers that those measures are more than just greenwashing. The most prominent of these efforts is the Science-Based Targets Initiative (SBTi), developed through a joint partnership between the United Nations Global Compact, the World Resources Institute, and the World Wildlife Fund for Nature in 2015. The Carbon Disclosure Project (CDP) joined in 2022. SBTi is a voluntary initiative for setting how much to reduce emissions by and when. Companies that commit to SBTi (via public letter) measure their emissions in scope 1 through 3. They then submit a target that aligns with IPCC emission reduction pathways and covers their emissions for the next 5 to 10 years. SBTi approves or rejects the target. Once approved, a company must disclose progress annually.
By 2022, 2097 firms had SBTI validated emissions targets covering 34% of global market capitalization. Since then, the number has grown rapidly to 8606 companies37. The benefits for companies of enrolling in SBTi remain unclear. Ko and Prakash analyzed the impact of SBTi emission reduction pledges on stock price38. They found no significant increases in stock prices attributable to SBTi membership (nor decrease). One challenge for a voluntary emissions target framework like SBTi is credibility and they speculate that markets may not yet draw the distinction between forms of greenwashing and SBTi enrollment. They note that SBTi has faced criticism for verification methods, including allowing firms to set their own base year for emissions reduction comparison. This is potentially gameable by selecting the base year based on highest emissions. They also note that benefits from SBTi may manifest in ways other than stock price, including on sales, employee retainment, and regulatory costs.
It remains to be seen whether non-stock price related benefits are a motivator for future voluntary climate action. The large growth in the number of companies participating suggests that they are, though enrolled companies are at early stages of reaching their targets, and their pledges may only be tested when achieving their targets requires more investment.
How are corporations applying SBTi to shrimp supply chains? One of the largest seafood importers into the US, Thai Union Group (known by the brand name “Chicken of the Sea” on supermarket shelves), is enrolled in SBTi with a commitment to reduce emissions by 42% across scopes 1,2, and 3 by 2030 and net zero by 205039. To help achieve their company-wide SBTi commitment, they are reducing shrimp aquaculture emissions through partnership with the Nature Conservancy and their North Star Shrimp Initiative.
The North Star Shrimp Initiative initially demonstrated a blueprint for reducing shrimp aquaculture emissions in Ecuador40. It is now being adopted in Asia as well. The Initiative targets all emission sources in the supply chain above (Figure 5), including switching to cleaner energy, sourcing feeds from deforestation-free soy and sustainable fish meal, restoring mangrove ecosystems, fostering partnerships with market leaders, and policy and financial programs to encourage more sustainable aquaculture. Designed to demonstrate the feasibility of sustainable practices, pilot deployments of the Initiative in Ecuador achieved 15-35% emissions reductions.
We therefore already have a choice based on emissions when it comes to shrimp. Purchase from companies known to have SBTi commitments and/or enrollment in sector specific emissions reduction frameworks and you can read their reported emissions and future targets. Purchase alternative products and their emissions remain obscure.
Public and private initiatives are likely to feed each other. For example, the work in Europe to track emissions via digital passports will motivate companies to track emissions and look for accepted and verifiable approaches to do it such as SBTi. Similarly, expanding emissions information and growing enrollment in SBTi may make state policy that controls scope 3 emissions more feasible through greater acceptance, participation, and information.
Final Word
Production-based emissions accounting alone leaves loopholes that, at best, paint an incomplete picture of our emissions responsibility. At worst, it could lead to unintended consequences that increase carbon leakage with tighter emissions targets in emissions-controlled regions and disincentivize controls in regions without them. Plus, it makes intuitive sense that I bear the responsibility for the embodied carbon of a shrimp on my plate – CBEI closes the loophole.
Public and corporate consumption-based emissions accounting quantifies the invisible carbon footprints left by all of us through the decisions we make. This information and how it’s shared can lead to personal or collective awareness of the consequences of those decisions and the opportunity to make different ones.
Public policy efforts and corporate commitments are now making that possible. Tools like Environmental Product Declarations (EPDs) and Digital Product Passports (DPPs) that are still in their early stages are gaining traction, particularly as the EU phases rollout of their Ecodesign for Sustainable Products Regulation (ESPR). At the same time, the scale of corporate commitments to reduce scope 1,2, and 3 emissions under SBTi is impressive.
The Costco shrimp we opened with already has competition from other shrimp with more sustainable stories. It may not be long before their respective travelogs are distilled into carbon intensity numbers for us all to see, and that can help us make more informed choices.
Explore the AI-generated explainer video summarizing the shrimp's journey and its implications:
References & Footnotes
- Steinmetz, G., & Bourne Jr., J. K. (2024). Feed the Planet: A Photographic Journey to the World's Food.
- Washington Department of Commerce, “Washington 2021 State Energy Strategy”, 2021.
- Global Carbon Budget – with major processing by Our World in Data. “Territorial emissions – GCB” [dataset], 2024. Global Carbon Project, “Global Carbon Budget” [original data], 2024.
- Moran, D., KGM & Associates, Hasanbeigi, A., Springer, C., Global Efficiency Intelligence, “The Carbon Loophole in Climate Policy”, 2018.
- Kanemoto et al., “International trade Undermines national emission reduction targets: New evidence from air pollution”, 2014.
- Global Carbon Budget – with major processing by Our World in Data. “Territorial emissions – GCB” [dataset], 2024. Global Carbon Project, “Global Carbon Budget” [original data], 2024.
- Environmental Protection Agency, “Consumption-Based Greenhouse Gas Inventories for Northeastern States”, 2024.
- Environmental Protection Agency, “Consumption-Based Greenhouse Gas Inventories for Northeastern States”, 2024.
- Global Carbon Budget – with major processing by Our World in Data. “Territorial emissions – GCB” [dataset], 2024. Global Carbon Project, “Global Carbon Budget” [original data], 2024.
- Clean Energy Transition Institute, “Net Zero Northwest”, 2023.
- Ashfaq et al., “Climate Equality: A Planet for the 99%”, Oxfam International, 2023.
- Task Force on National Greenhouse Gas Inventories, “2006 IPCC Guidelines for National Greenhouse Gas Inventories”, 2006.
- Ingwersen, W. W., B. Young. Consumption-Based Greenhouse Gas Inventories for Northeastern States. U.S. Environmental Protection Agency, 2024.
- Different products face different levels of exposure to these pressures. Finished electronic products, for example, have less embodied carbon as a fraction of their overall value than emissions intensive industries like cement or steel. Carbon controls will therefore impact the competitiveness of this latter category more than others because they will have a greater percentage impact on price.
- World Wildlife Fund, “Measuring and Mitigating GHGs: Shrimp”, 2022.
- World Wildlife Fund, “Measuring and Mitigating GHGs: Beef”, 2022.
- Bianchi, M. et al., “Assessing seafood nutritional diversity together with climate impacts informs more comprehensive dietary advice”, Nature Communications Earth & Environment, 2022.
- Mollusks such as mussels and oysters are very low emissions intensity. They require no food and at least some of the carbon they collect in the form of calcium carbonate in their shells will be locked up.
- Järviö, N., Henriksson, P.J.G. & Guinée, J.B., “Including GHG emissions from mangrove forests LULUC in LCA: a case study on shrimp farming in the Mekong Delta, Vietnam” Int J Life Cycle Assess 23, 1078–1090, 2018.
- Pattanaik, C., Prasad, S.N., “Assessment of aquaculture impact on mangroves of Mahanadi delta (Orissa), East coast of India using remote sensing and GIS”, Ocean & Coastal Management 54 (11), 789-795, 2011.
- White, C., “Shrimp Insights study: Indian industry’s role in mangrove degradation overblown”, SeafoodSource, 2024.
- Peroni, F., “Promising year for Peruvian anchovy set to support aquaculture”, S&P Global, 2025.
- kgCO2e/kg shrimp
- Henriksson et al., “Final LCA case study report – results of LCA studies of Asian aquaculture systems for tilapia, catfish, shrimp, and freshwater prawn”, Sustaining Ethical Aquaculture Trade, 2014.
- World Wildlife Fund, “Measuring and Mitigating GHGs: Shrimp”, 2022.
- International Standards Organization, “ISO 14044:2006 Environmental management – Life cycle assessment – Requirements and guidelines”, 2006, reviewed and confirmed 2022.
- Journal of the World Aquaculture Society Editorial, “A decadal outlook for global aquaculture”, 2023.
- International Standards Organization, “ISO 14025:2006 Environmental labels and declarations – Type III environmental declarations – Principles and procedures”, 2006, reviewed and confirmed 2020.
- UL Solutions, “Product Category Rules (PCRs)”.
- Cox, R., Milko, J., “Lessons Learned form California Buy Clean”, Thirdway, 2022.
- Rizos, V., Urban, P., “Implementing the EU Digital Battery Passport”, CEPS, 2024.
- Dechezlepretre, A. et al., “Carbon Border Adjustments: The potential effects of the EU CBAM along the supply chain”, OECD Science, Technology and Industry Working Papers, 2025.
- Hoffmann, S. et al., “Eight key aspects to know about the EU Ecodesign for Sustainable Products Regulation”, White & Case, 2025.
- EU Green Forum, “Green Public Procurement: Procuring goods, services and works with a reduced environmental impact throughout their life cycle”
- Sasatani, D., “Japan Proposed to Include Greenhouse Gas Emissions in the Criteria for Government Procurement Decisions”, United States Department of Agriculture Foreign Agricultural Service, 2022.
- The Greenhouse Gas Protocol, “A Corporate Accounting and Reporting Standard”.
- Science Based Targets, “Target Dashboard”.
- Ko, I., Prakash, A., “Stock markets, corporate climate pledges, and the Science-Based Target Initiative”, Nature NPJ Climate Action 3, 2024.
- Thai Union, “Thai Union launches Seachange 2030, committing THB 7.2 billion (USD 200 million) to advance sustainability goals”, 2023.
- The Nature Conservancy, “A Better Shrimp Supply Chain for People and the Planet”, 2023.